
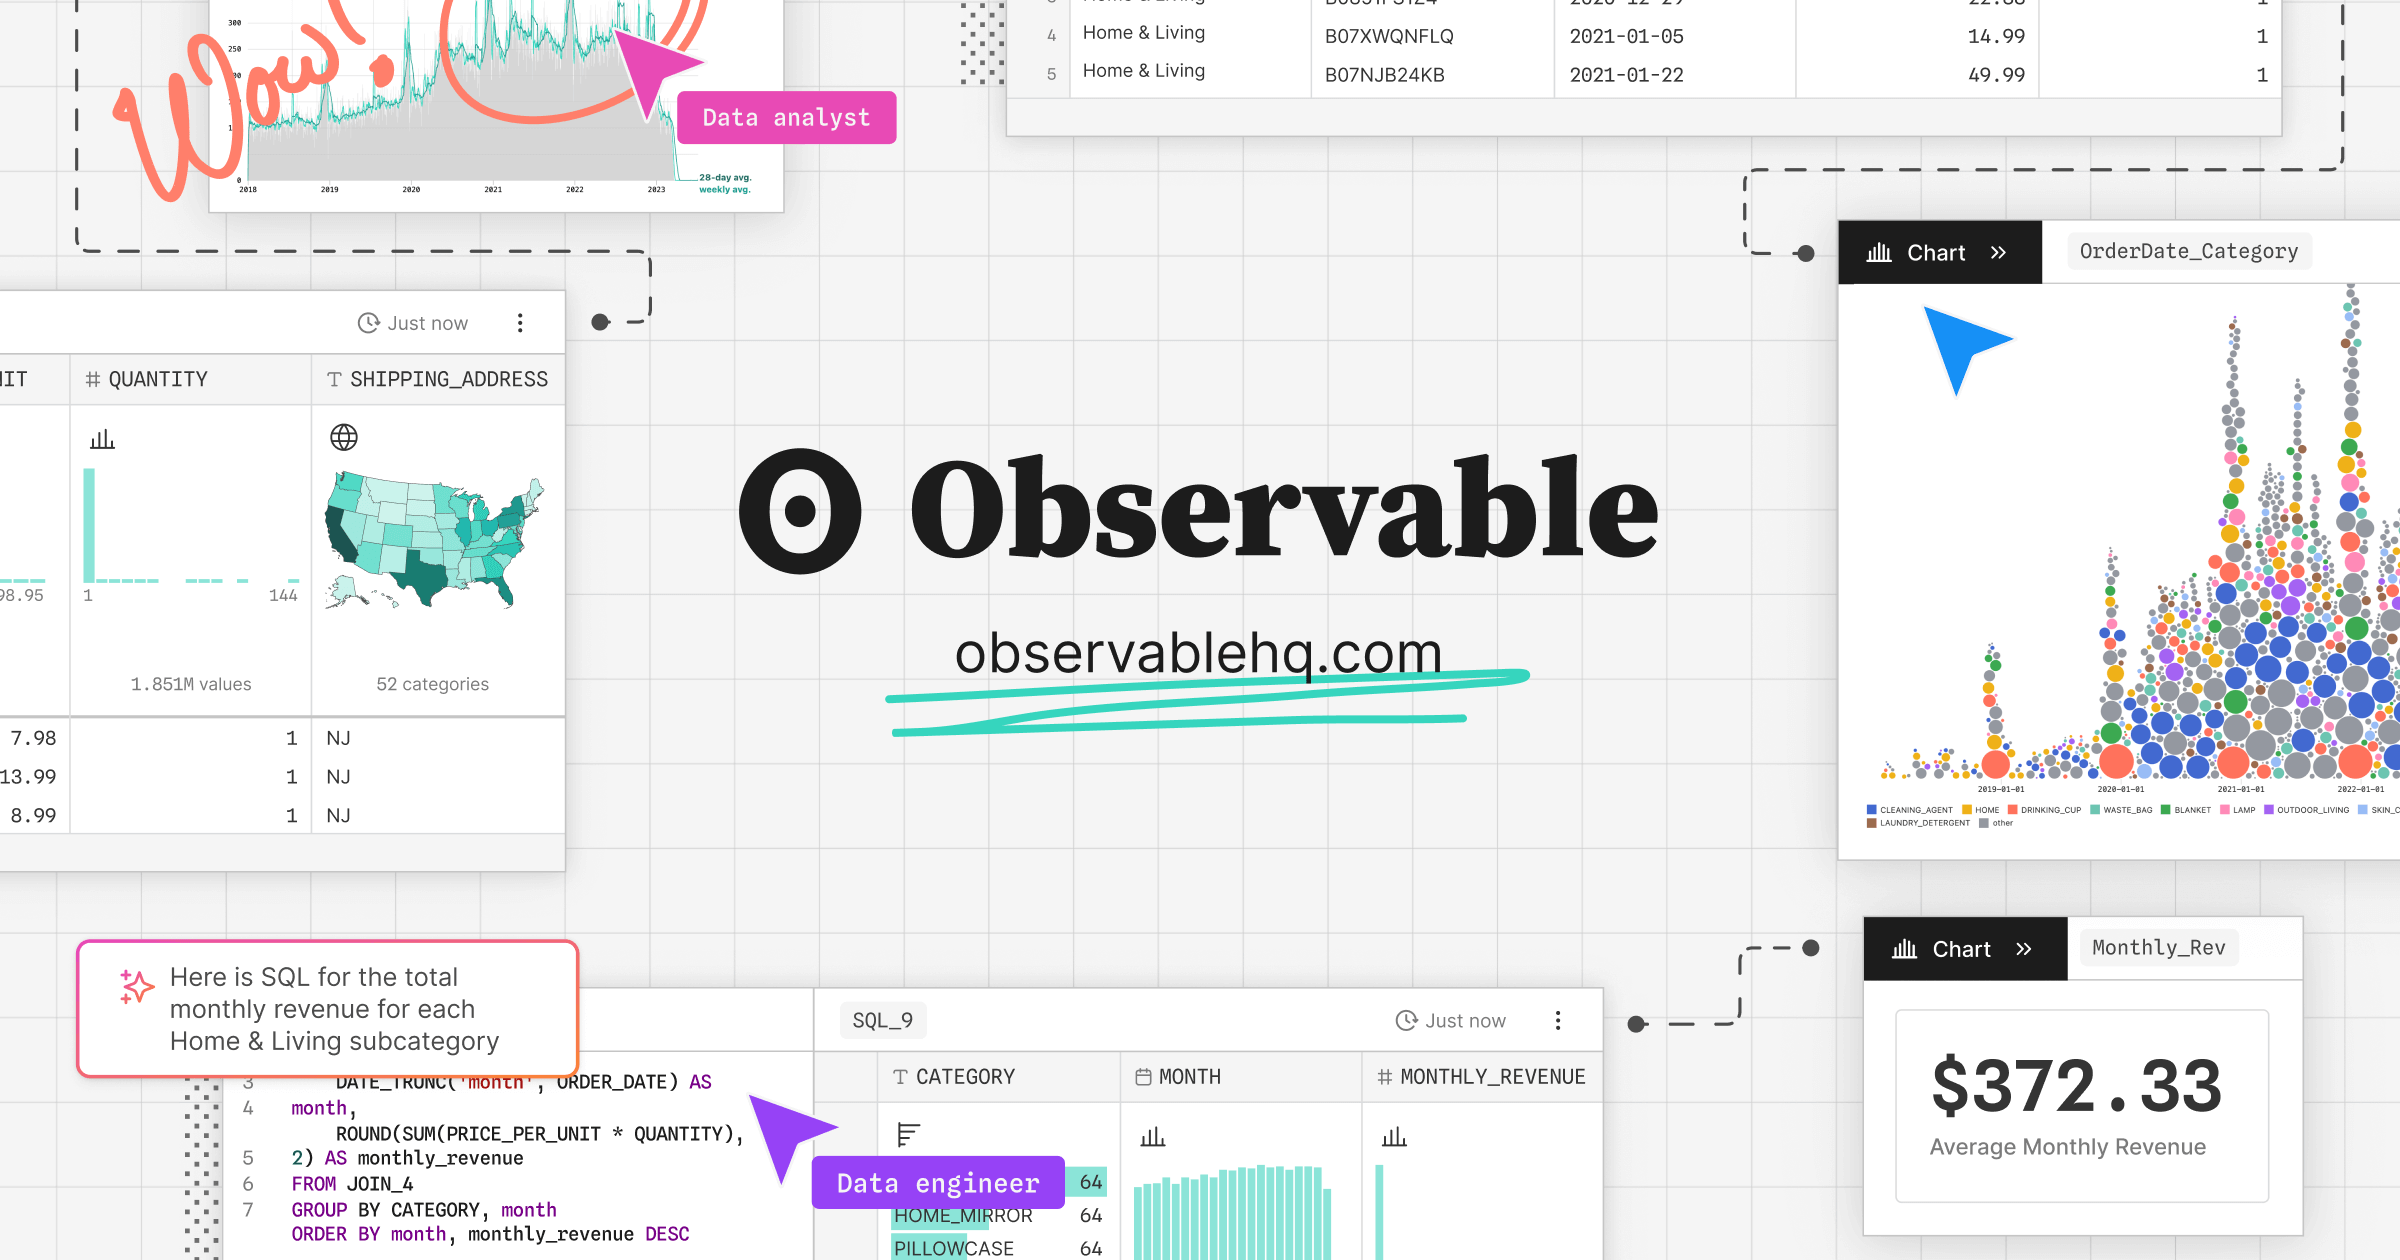
observablehq.com
Get leads like Observablehq — and thousands more
Build targeted lists by tech stack, traffic, and more
Observable: The Notebook-First Data Empire
How a D3.js spin-out built a $7.8M visual analytics platform with 4.5M backlinks
Observable isn't just another charting library—it's a complete reimagining of how data professionals collaborate. Born from the creator of D3.js, this platform transforms static reports into living, explorable datasets where code, data, and visualization coexist.
"Observable didn't just build a visualization tool—they built an entire data workflow ecosystem that makes Excel look like a calculator from 1985."
The Creator's Legacy
Mike Bostock, D3.js creator, didn't stop at building the world's most powerful visualization library. He recognized the real bottleneck: data scientists and analysts waste 80% of their time moving data between tools. Observable's notebook-first approach eliminates this friction by letting code, data, and charts live in the same reactive environment. Every cell automatically updates when dependencies change—no more manual refreshes or broken pipelines.
The Viral Growth Engine
With 42% organic traffic and 4.5M backlinks, Observable has built an SEO fortress that competitors can't touch. Their content strategy is brilliant: every notebook is a potential search result. 'Observable Plot' alone drives 910 monthly searches, while niche queries like 'independent y scale facet observable plot' capture long-tail traffic that traditional BI tools ignore. This isn't accidental—it's a platform where users create the very content that drives new users.
The platform's secret sauce is its reactive programming model. Unlike Tableau or Power BI where you're locked into drag-and-drop interfaces, Observable lets you write JavaScript that automatically re-executes when inputs change. This creates a virtuous cycle: power users build complex dashboards, share them publicly, and those notebooks become marketing assets that attract developers frustrated with traditional tools' limitations.
- Reactive programming model eliminates manual refresh workflows
- Public notebook sharing creates organic SEO content at scale
- D3.js heritage attracts developers who've outgrown Chart.js
- Collaboration is built-in, not bolted-on like enterprise BI tools
Observable is the GitHub of Data Visualization
While Tableau sells dashboards, Observable sells collaboration—and that's why it's winning the developer mindshare
What tech stack does Observablehq use?
How much traffic does Observablehq get?
Traffic & Engagement
Rankings
Backlinks & Authority
Search Traffic
Top Organic Keywords
Where is Observablehq's audience located?
Who competes with Observablehq?
Device Distribution
What keywords does Observablehq rank for?
5 keywordsHow is Observablehq's SEO?
Open Graph Image
https://static.observablehq.com/assets/marketing/meta/og-image-250804.png
Meta Tags
Observable | The modern data visualization platform | Observable
Observable is an all-in-one platform for data visualization with tools for developers, data analysts, and collaborators.
H1 Tags
Schema Types
What is Observablehq's revenue?
Who competes with Observablehq?
Who works at Observablehq?
Loading leads...
What do customers think of Observablehq?
No Trustpilot reviews available for this company.
Frequently Asked Questions about Observablehq
What is Observablehq's Revenue?
What does Observablehq do?
How fast is Observablehq growing?
How do people interact with Observablehq?
How do people find Observablehq?
Who uses Observablehq?
What technologies does Observablehq use?
Who are Observablehq's competitors?
Export Data
Unlock all exports
Download CSVs, JSONs & full reports
How to contact Observablehq?
Contact Information
Export observablehq.com Data
Download the complete tech stack, analytics, leads, and company data for observablehq.com in JSON or CSV format. Use it for your sales pipeline, competitive analysis, or research.
Raw JSON Data
Click "Show" to view the raw API response data
About observablehq.com
Observable is an all-in-one platform for data visualization with tools for developers, data analysts, and collaborators.
Company Overview
observablehq.com Social Media
Contact observablehq.com
Email Addresses
Phone Numbers
Technology Stack
observablehq.com uses 13 technologies across their website including HSTS, Sentry, Cloudflare, and more.
Security
HSTS
Error Tracking
Sentry
Cloud & Hosting
Cloudflare
Advertising
LinkedIn Insight Tag
Analytics & Marketing
Clarity, Google Analytics
Performance
Lazy Loading
Traffic & Audience
observablehq.com receives approximately 447.7K monthly visitors and ranks #113,763 globally. The website has a bounce rate of 49% with visitors viewing an average of 2.4 pages per visit. Users spend an average of 1:42 on the site.
The majority of observablehq.com's traffic comes from undefined, undefined, .
Frequently Asked Questions
What is observablehq.com?
How much does observablehq.com cost?
What technologies does observablehq.com use?
How do I contact observablehq.com?
What are observablehq.com's social media accounts?
Is observablehq.com hiring?
How popular is observablehq.com?
Related Searches
This page provides publicly available information about observablehq.com. Data is collected from various public sources and may not always be up to date. For the most accurate information, please visit observablehq.com directly at https://observablehq.com.