
fintech.net
Get leads like Fintech — and thousands more
Build targeted lists by tech stack, traffic, and more
The Procure-to-Pay Dark Horse
How a $452M food & drink fintech is quietly automating B2B workflows
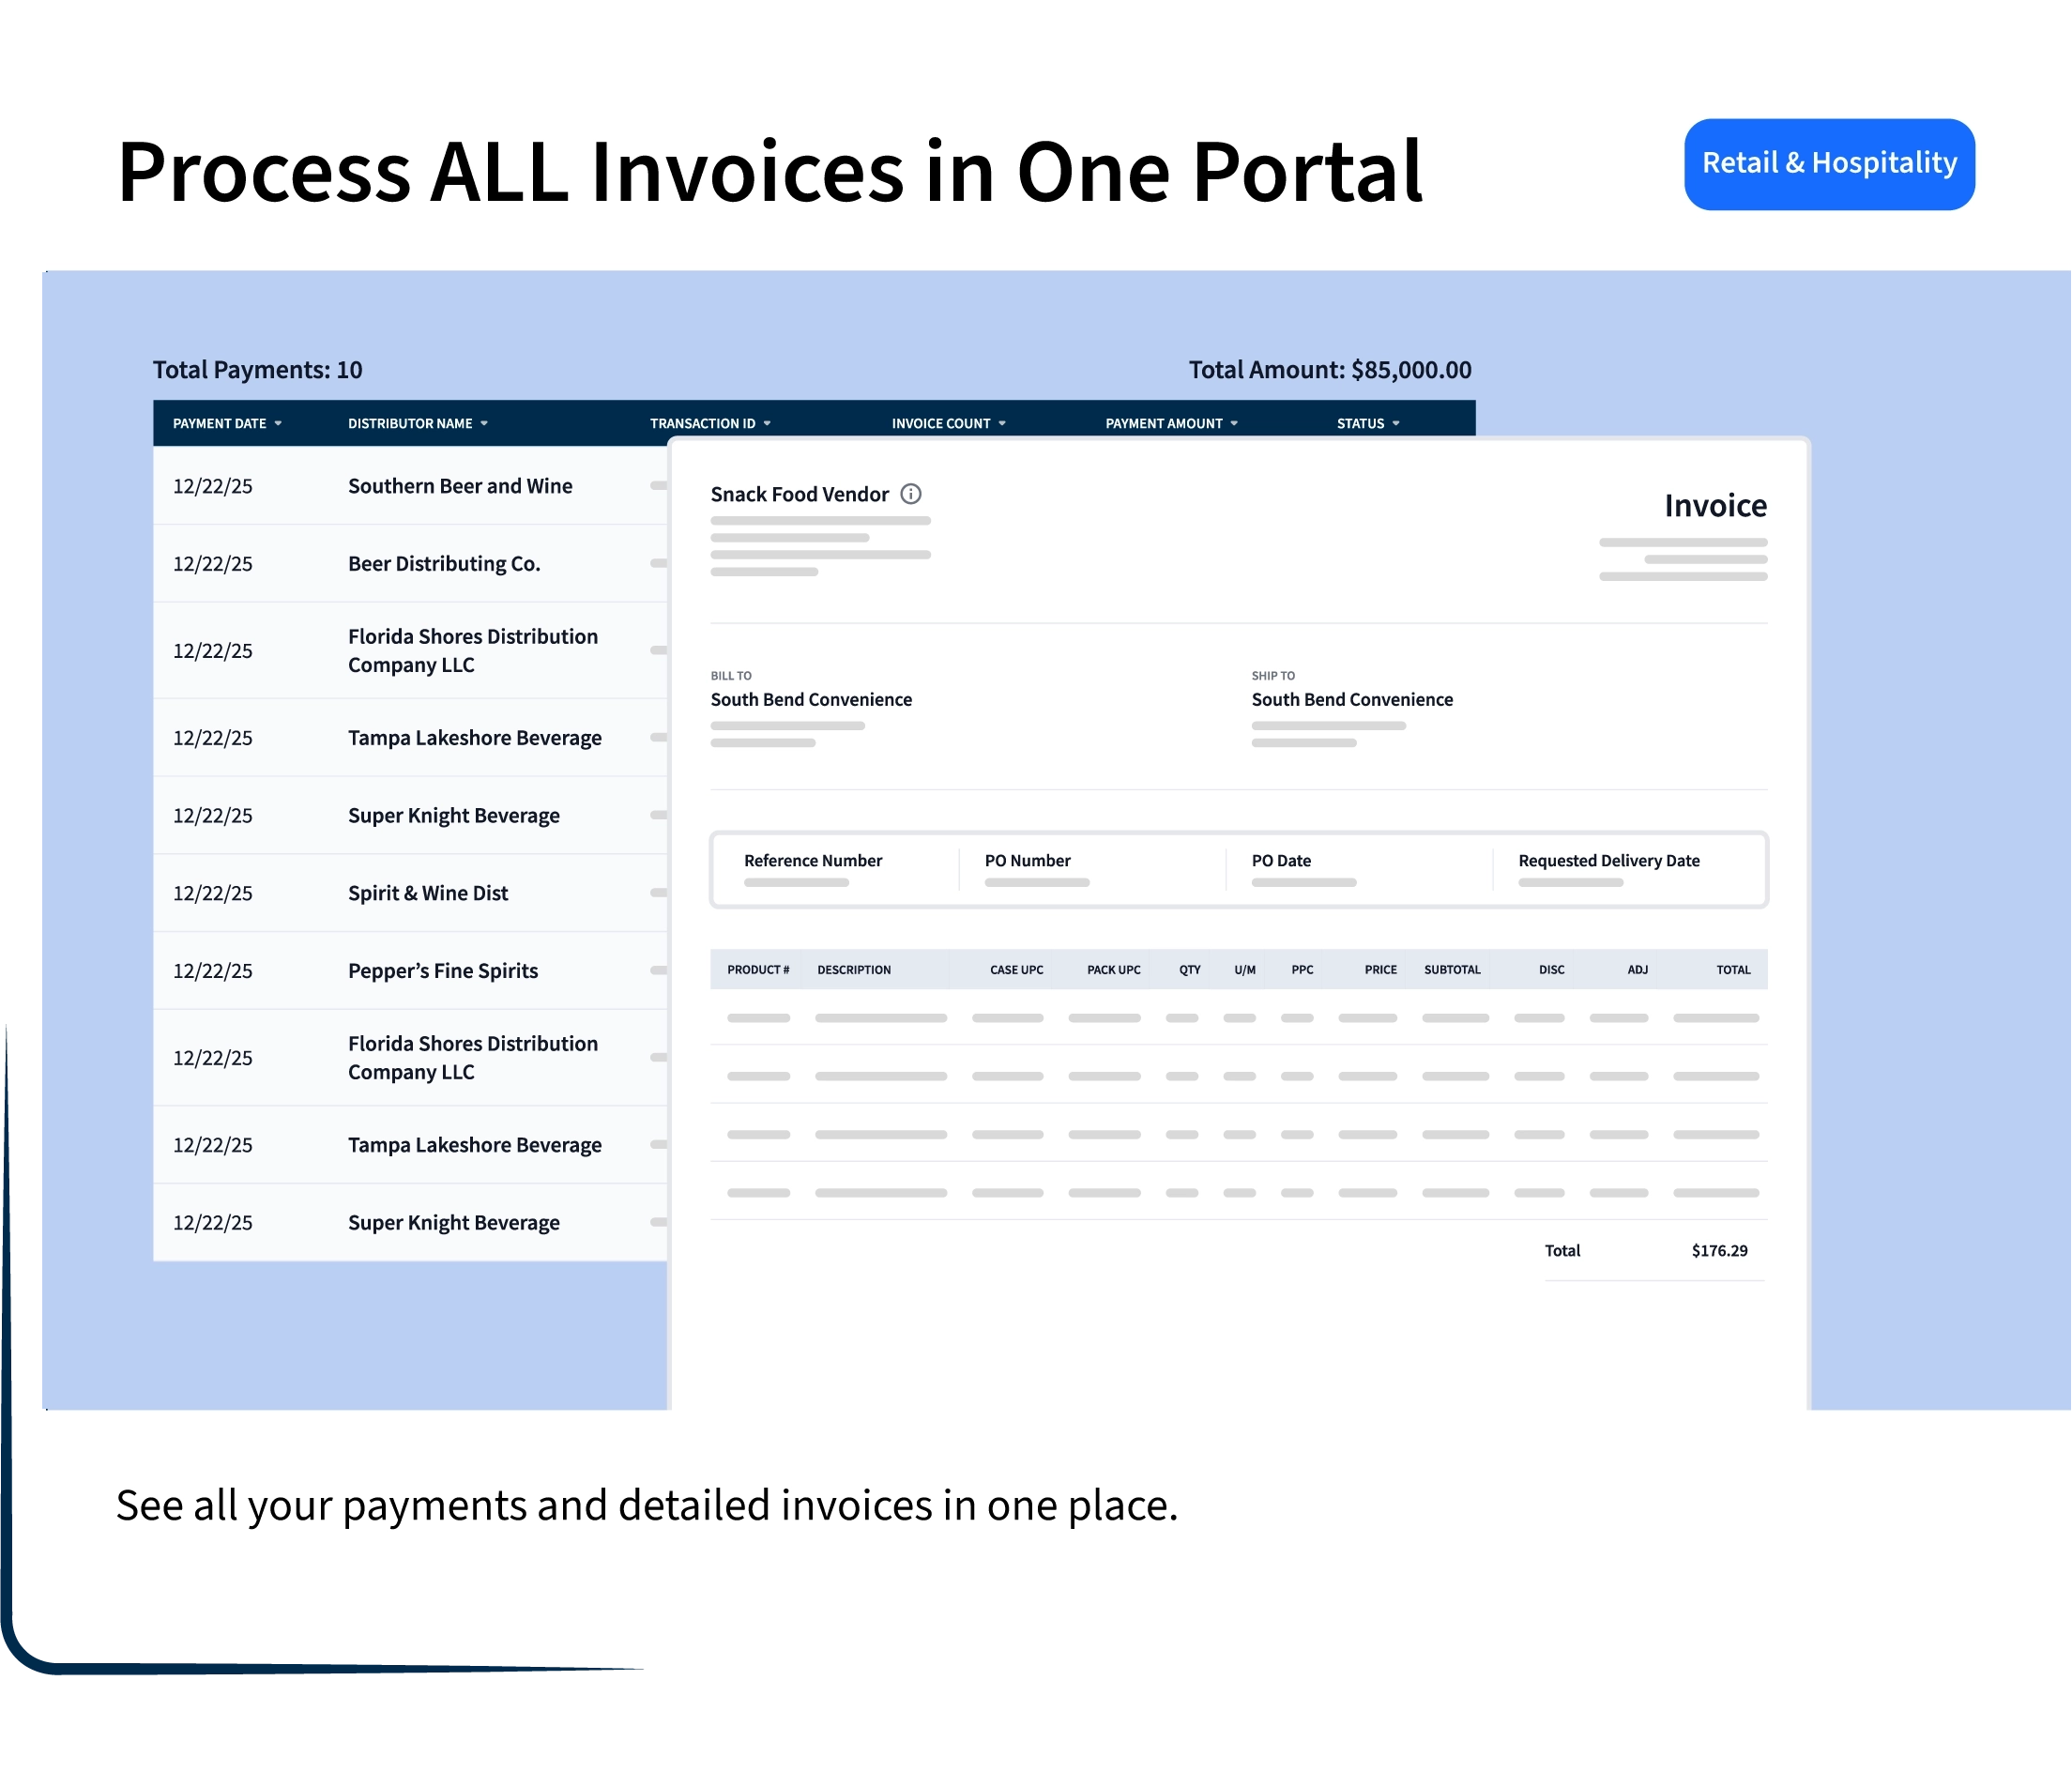
In a world obsessed with consumer fintech, fintech.net is quietly building a $452M empire by automating the unsexy, complex B2B processes that keep global supply chains moving. They aren't chasing retail users; they're fixing the broken procure-to-pay workflow for food and drink giants.
"They aren't a consumer fintech app. They're the invisible automation layer for the food and drink industry's back office."
The Enterprise Paradox
Fintech.net operates on a counter-intuitive model: massive revenue ($452.5M) with minimal public web presence (570 monthly visits). This isn't a marketing failure—it's a sign of deep enterprise penetration. Their 52% direct traffic indicates a captive audience logging in daily, not browsing for solutions. They've built a moat where clients come directly to them, bypassing search engines entirely.
The Automation Play
While competitors chase flashy AI chatbots, fintech.net applies automation to the gritty reality of procure-to-pay. Their tech stack (jQuery, Swiper, Tailwind) suggests a pragmatic, functional approach over flashy UX. With 2,434 employees, they've scaled human expertise alongside AI—proving that in complex B2B workflows, hybrid intelligence beats pure automation.
The traffic data reveals a telling story. With 31% organic search and 52% direct traffic, fintech.net isn't winning through SEO or content marketing. They're winning through enterprise contracts and word-of-mouth in the food and drink industry. Their single tracked keyword—'fintech tampa'—suggests a regional foothold, likely where their headquarters or a major office anchors their operations.
- Revenue density: $452M with 2,434 employees = $185K revenue per employee
- Traffic paradox: High revenue with low public visibility signals deep enterprise integration
- Industry focus: Food & drink niche allows for specialized, high-value solutions
- Tech pragmatism: Uses stable, proven stacks rather than bleeding-edge frameworks
The Quiet Giant Strategy
Fintech.net proves that in B2B, revenue speaks louder than traffic. They're not building a brand for the masses—they're building infrastructure for an entire industry.
What tech stack does Fintech use?
How much traffic does Fintech get?
Traffic & Engagement
Traffic Sources
Where is Fintech's audience located?
What keywords does Fintech rank for?
1 keywordsHow is Fintech's SEO?
Open Graph Image
https://fintech.com/wp-content/uploads/2025/12/PaymentSource_Retailers_Home_Hero.webp
Meta Tags
B2B Invoice Automation Solutions | Fintech LLC
Fintech uses automation and AI to simplify complex B2B processes and remove bottlenecks in the procure-to-pay process.
Fintech LLC
H1 Tags
Schema Types
What is Fintech's revenue?
Who competes with Fintech?
Who works at Fintech?
Loading leads...
What do customers think of Fintech?
No Trustpilot reviews available for this company.
Frequently Asked Questions about Fintech
What is Fintech's Revenue?
What does Fintech do?
How fast is Fintech growing?
What technologies does Fintech use?
Who are Fintech's competitors?
Export Data
Unlock all exports
Download CSVs, JSONs & full reports
How to contact Fintech?
Export fintech.net Data
Download the complete tech stack, analytics, leads, and company data for fintech.net in JSON or CSV format. Use it for your sales pipeline, competitive analysis, or research.
Raw JSON Data
Click "Show" to view the raw API response data
About fintech.net
Fintech uses automation and AI to simplify complex B2B processes and remove bottlenecks in the procure-to-pay process.
Company Overview
fintech.net Social Media
Contact fintech.net
Technology Stack
fintech.net uses 21 technologies across their website including Font Awesome, Google Fonts, PHP, WordPress, and more.
Fonts
Font Awesome, Google Fonts
Programming Languages
PHP
CMS
WordPress
Advertising
DoubleClick Floodlight, Facebook Pixel
Analytics & Marketing
Heap, Hotjar, Google Tag Manager, Google Analytics
Performance
Lazy Loading, Priority Hints
Traffic & Audience
fintech.net receives approximately 570 monthly visitors. The website has a bounce rate of 42% with visitors viewing an average of 2.4 pages per visit. Users spend an average of 0:56 on the site.
The majority of fintech.net's traffic comes from .
Frequently Asked Questions
What is fintech.net?
What technologies does fintech.net use?
How do I contact fintech.net?
What are fintech.net's social media accounts?
Is fintech.net hiring?
How popular is fintech.net?
Related Searches
This page provides publicly available information about fintech.net. Data is collected from various public sources and may not always be up to date. For the most accurate information, please visit fintech.net directly at https://fintech.net.