
webexpenses.com
Get leads like Webexpenses — and thousands more
Build targeted lists by tech stack, traffic, and more
Webexpenses: The UK's Expense Control Engine
How a 121-person team commands a $17.5M revenue niche with 2,000+ finance teams.
In a world drowning in SaaS sprawl, Webexpenses quietly dominates a boring but critical vertical: expense management. With 2,000+ UK finance teams locked in, they've turned the mundane task of tracking receipts into a high-margin, low-churn empire.
"66% direct traffic isn't just a metric; it's proof of a sticky product that finance teams treat like oxygen."
The Finance Moat
Webexpenses doesn't chase the startup crowd. They target the UK enterprise backbone. With 2,000+ trusted finance teams, they've built a product that requires zero marketing fluff—it sells itself via word-of-mouth in boardrooms. The revenue per employee is a healthy ~$144k, signaling a lean, efficient operation that prioritizes product stickiness over vanity growth.
The Traffic Paradox
Here’s the counter-intuitive data: despite being a digital product, only 26% of their traffic comes from organic search. The overwhelming 66% comes from direct visits. This suggests a market where users don't 'shop around'—they log in. The brand is so dominant that competitors like 'webexpesne' and 'webexpens' (typos capturing 100+ monthly searches) are effectively wasted leads they still own.
The tech stack tells a story of modern efficiency. They lean on Vite for speed and Tailwind CSS for design consistency, but the heavy presence of Ant Design and Bootstrap hints at a pragmatic approach: build fast, scale reliable. They aren't reinventing the wheel; they're greasing it for 2,000 finance teams to roll smoothly.
- The 'Webexpenses' keyword captures 1,710 monthly searches—pure brand dominance in a niche sector.
- Revenue per employee (~$144k) rivals top-tier B2B SaaS efficiency metrics.
- 66% direct traffic indicates a product deeply embedded in daily workflows, not just a 'nice-to-have' tool.
The Boring Billion-Dollar Playbook
Webexpenses proves that in B2B SaaS, dominating a boring niche is more profitable than chasing hype.
What tech stack does Webexpenses use?
How much traffic does Webexpenses get?
Traffic & Engagement
Traffic Sources
Where is Webexpenses's audience located?
What keywords does Webexpenses rank for?
5 keywordsHow is Webexpenses's SEO?
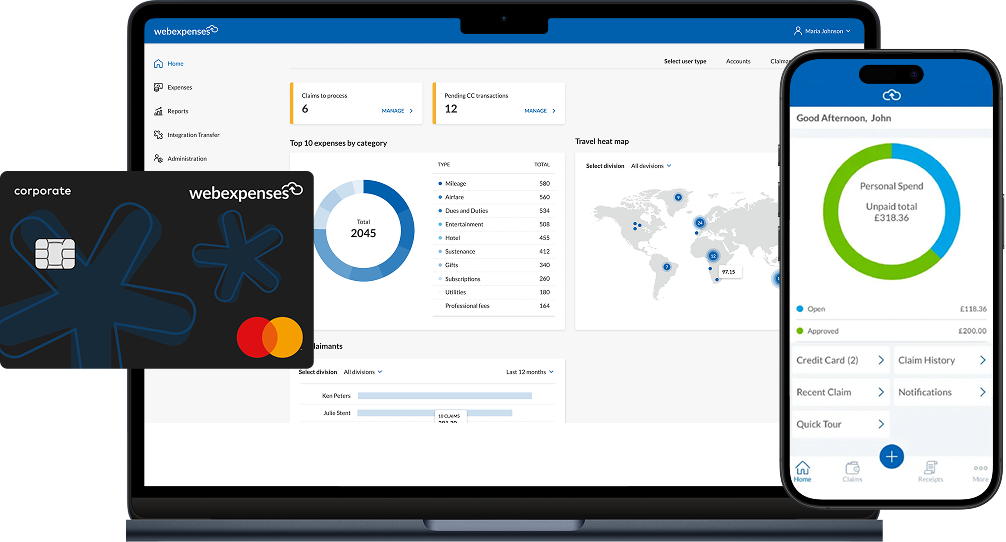
Open Graph Image
https://www.webexpenses.com/wp-content/uploads/2025/06/Webexpenses-Platform.png
Meta Tags
Expense Management Software | Webexpenses
Track, manage & control business expenses with our easy-to-use automated expense management system. Trusted by 2,000+ UK finance teams. Book a demo
H1 Tags
Schema Types
What is Webexpenses's revenue?
Who works at Webexpenses?
Loading leads...
What do customers think of Webexpenses?
webexpenses
Categories
Activity & Engagement
Contact Information
Reviews (0)
No reviews found. Reviews may not be available in the initial page load. Try refreshing or check the Trustpilot page directly.
Frequently Asked Questions about Webexpenses
What is Webexpenses's Revenue?
What does Webexpenses do?
How fast is Webexpenses growing?
What technologies does Webexpenses use?
Who are Webexpenses's competitors?
What do customers think of Webexpenses?
Export Data
Unlock all exports
Download CSVs, JSONs & full reports
How to contact Webexpenses?
Contact Information
Export webexpenses.com Data
Download the complete tech stack, analytics, leads, and company data for webexpenses.com in JSON or CSV format. Use it for your sales pipeline, competitive analysis, or research.
Raw JSON Data
Click "Show" to view the raw API response data
About webexpenses.com
Track, manage & control business expenses with our easy-to-use automated expense management system. Trusted by 2,000+ UK finance teams. Book a demo
Company Overview
webexpenses.com Social Media
Contact webexpenses.com
Phone Numbers
Technology Stack
webexpenses.com uses 26 technologies across their website including Font Awesome, HSTS, PHP, and more.
Fonts
Font Awesome
Security
HSTS
Programming Languages
PHP
CMS
Contentful, WordPress
Cloud & Hosting
Cloudflare
Privacy & Consent
Cookiebot
Traffic & Audience
webexpenses.com receives approximately 82.7K monthly visitors and ranks #294,410 globally. The website has a bounce rate of 26% with visitors viewing an average of 7.5 pages per visit. Users spend an average of 7:27 on the site.
The majority of webexpenses.com's traffic comes from undefined, undefined, .
Frequently Asked Questions
What is webexpenses.com?
How much does webexpenses.com cost?
What technologies does webexpenses.com use?
How do I contact webexpenses.com?
What are webexpenses.com's social media accounts?
Is webexpenses.com hiring?
How popular is webexpenses.com?
Related Searches
This page provides publicly available information about webexpenses.com. Data is collected from various public sources and may not always be up to date. For the most accurate information, please visit webexpenses.com directly at https://webexpenses.com.